Overview
GEO Evaluator (Generative Engine Optimization Evaluator) is a powerful analysis tool that examines websites across 5 key categories to determine how well they’re optimized for LLM understanding based on semantic structure. It provides actionable insights and recommendations to improve your brand’s visibility and accuracy in AI-generated responses.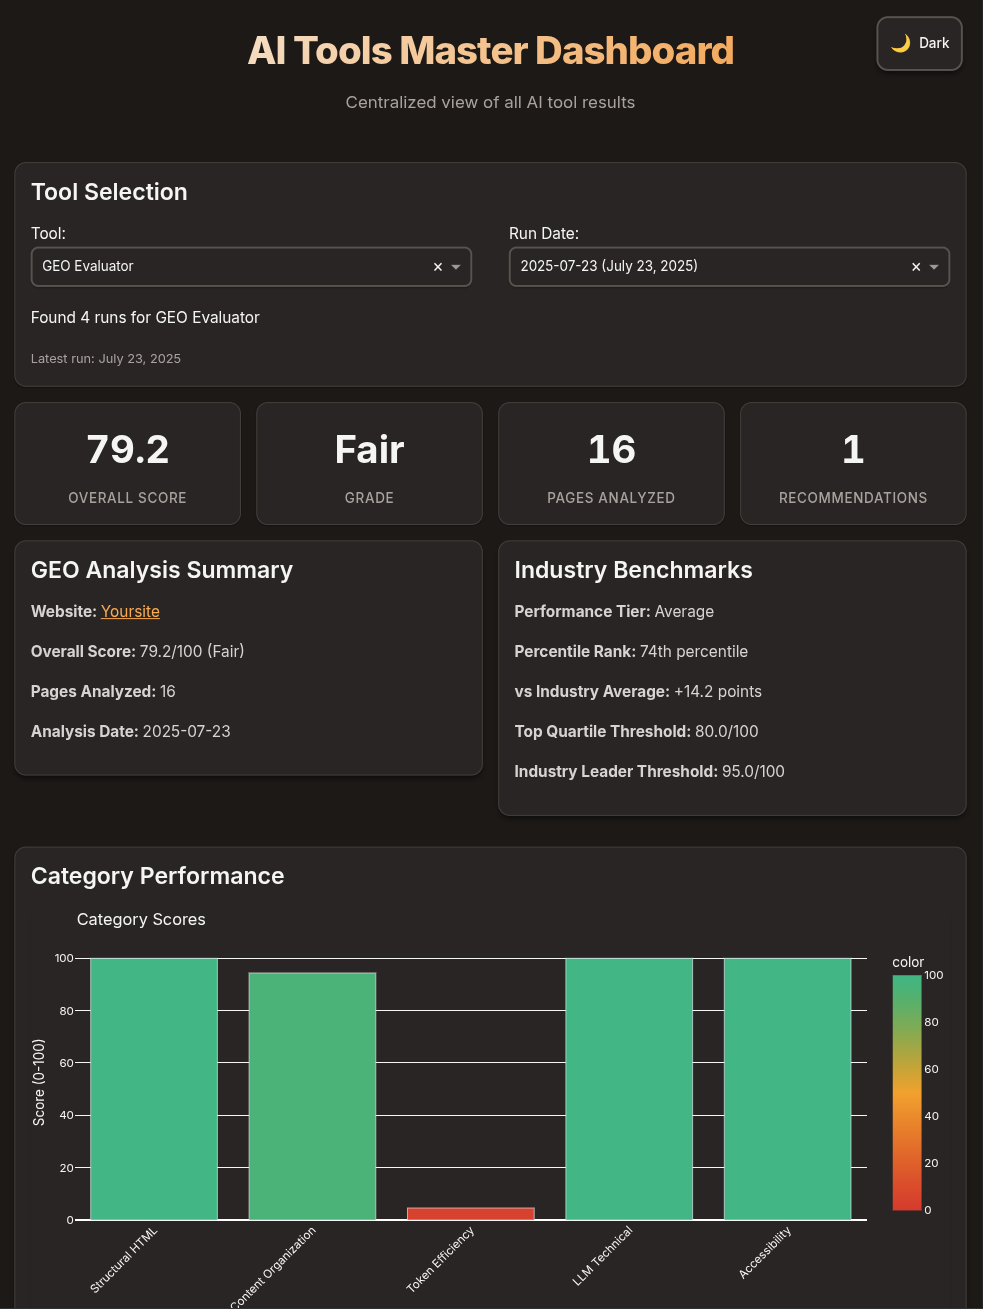
Key Features
Structural HTML
25% WeightAnalyzes semantic markup, heading hierarchy, and content landmarks
Content Organization
30% WeightEvaluates paragraph structure, scannability, and FAQ formatting
Token Efficiency
20% WeightMeasures content-to-markup ratio and information density
LLM Technical
15% WeightChecks llms.txt, structured data, and meta optimization
Accessibility
10% WeightReviews alt text, link context, and language clarity
How it Works
Individual Page Scoring
Individual Page Scoring
Every page is analyzed individually with category-specific scores, not just site-wide averages. This helps identify exactly which pages need improvement.
Affected Pages Tracking
Affected Pages Tracking
Recommendations include specific pages that need attention, with clickable links and relevant metrics (word count, content ratio, etc.).
Auto-Launch Dashboard
Auto-Launch Dashboard
When using the
--dashboard flag, the master dashboard automatically opens after analysis completes, showing your results immediately.Industry Benchmarks
Industry Benchmarks
Compare your scores against industry averages, top quartile, and leader thresholds to understand your competitive position.
Getting Started
Usage
- Basic Usage
- Configuration File
- Advanced Options
Understanding Your Score
Overall Score
Your website receives a score from 0-100 with a letter grade:
- 90-100: Excellent (A)
- 80-89: Good (B)
- 70-79: Fair (C)
- 60-69: Poor (D)
- Below 60: Very Poor (F)
Category Breakdown
Each category contributes to your overall score based on its weight. Focus on improving categories with:
- Low scores
- High weights
- Many affected pages
Recommendations
Prioritized action items show:
- What needs fixing
- Why it matters
- Which pages are affected
- Expected impact
Dashboard Features
Analysis Summary
Side-by-side view of key metrics and industry benchmarks in a responsive layout
Visual Indicators
Color-coded scores and progress bars for quick assessment
Recommendations
Expandable recommendations showing affected pages with direct links
Page Scores Table
Sortable table of individual page scores across all categories
Common Optimization Tips
Priority Recommendations
Content Organization Best Practices
Optimize for Scannability:
- Keep paragraphs under 150 words
- Use bullet points and numbered lists
- Include FAQ sections with clear Q&A formatting
- Break content with descriptive subheadings
Configuration Examples
E-commerce Site Configuration
Content-Heavy Blog Configuration
Troubleshooting
No pages crawled
No pages crawled
- Check if robots.txt is blocking the crawler
- Verify the website URL is accessible
- Review excluded_paths configuration
- Try increasing timeout_seconds
Low scores despite good content
Low scores despite good content
- Check for excessive navigation/sidebar markup
- Ensure you’re using semantic HTML elements
- Implement an llms.txt file
- Review your content-to-markup ratio
Dashboard not showing results
Dashboard not showing results
- Ensure you used the
--dashboardflag - Check that
dashboard-data.jsonexists in results folder - Verify the dashboard is scanning the correct directory
- Look for errors in dashboard logs
API Reference
Command Line Options
Output File Structure
Integration
CI/CD Pipeline Integration
Python Integration
Best Practices
Regular Monitoring
Run weekly or monthly analyses to track improvements and catch regressions
Focus on High-Impact
Address high-priority recommendations first for maximum ROI
Test Changes
Re-run analysis after making changes to verify improvements
Compare Competitors
Analyze competitor sites to understand industry benchmarks
Support
Need Help?
- Check the troubleshooting section above
- Review the detailed README.md in the tool directory
- Submit issues to the project repository
- Contact the development team for assistance